This website contains the trip data from 2016 quarter 3 to 2022 quarter 1 (as of April 2022). We will be analyzing their 2021 quarter 2 to 2022 quarter 1 data (April 2021- March 2022). The data is downloaded as CSV, which contains variables such as the duration, start and end locations, trip route categories, bike types, and the passholder types.
Since the trip data does not include the names of the start and end stations, we performed an outer join with the station data, available as a CSV file on the same website, including variables such as the first date station is available, and the status (as of April 2022). We also utilized Excel formulas to count the number of trips starting and ending at the same location, in order to map their popularity.
Furthermore, there is real-time station status data available in the GeoJSON file, which allows us to map the station locations and available bikes in real-time, mimicking the metro bike share app’s map.
The data, however, does have some limitations that we had to further clean before mapping. The data include a “virtual station,” which is used by staff to check in or check out a bike remotely for a special event or in a situation in which a bike could not otherwise be checked in or out to a station. Although some of the virtual station’s data have the latitude and longitude data, we have removed these trips from the map to avoid popularity bubbles showing up at random locations. In addition, some short round trips or long trips that could be system or user error was still kept in the dataset for completeness.
| Trip ID | Trip identification number per bike |
|---|---|
| Duration | Time measurement of bike usage in minutes |
| Start (End) Time | Date and Start (End) Time in regular time of bike usage |
| Start (End) Station | Station ID number of bike trip’s start/end location |
| Start(End) Lat/ Start(End) Lon | Geographic latitude coordinate of bike trip’s start (end) location |
| Bike ID | Bike identification tag |
| Plan Duration | Usage of bike determined by passholder type: 1 - Walk-Up 30- Monthly 365- Annual |
| Trip Route | One Way or Roundtrip |
| Passholder |
3 types are available provided by Metro: Walk-Up Monthly Pass Annual Pass |
| Bike Type | Standard or Electric |
This website contains the data on existing bikeways in Los Angeles. It was downloaded as a CSV or GeoJSON file. We used this as one of the layers in our map, so users can easily understand which roads currently have bike lanes.
Visualizations help us understand what information we have in our data. Below are our experimental visualizations made on Tableau and what they helped show us about the bike data.

Our data set includes all station locations in Los Angeles and the number of bikes rented/returned at each station
From the above heat map, the most popular start stations is Ocean Front & Navy with a total of over 11,000 bikes being rented out from April 2021-March 2022.This station is located right in front of Venice Beach. The top five start stations are located in Western part of the city where restaurants, bars, and tourist attractions are highly visited. The other stations are generally located in West LA and Downtown.Overall, the busiest end stations are located in areas where income is significantly higher. These locations are also close to beaches and recreation areas.From these stations, we can optimize inventory problems and service improvements.

Similarly, for end times the most popular end station is Ocean Front & Navy with a total of over 11,000 returned bikes from the four quarters. The top five stations are also located in West Los Angeles and Downtown. When comparing the two, these locations are very useful and popular in gathering riders that are starting and ending bike trips. Notably, each of these stations have high concentrations of population and traffic.

From the above graph it is evident that out of the total trips of over 200,000, around 47% of trips are by monthly pass holders. The second highest bike riders are walk-ups which account for about 30% of the trips. Annual Pass holders use the least amount of trips, similar to the one-day pass holders. Overall, the Metro Bike Program’s most popular pass is the monthly. Given that walk-ups are for one use only, the company should focus on attracting more pass holders for more efficiency and profit.
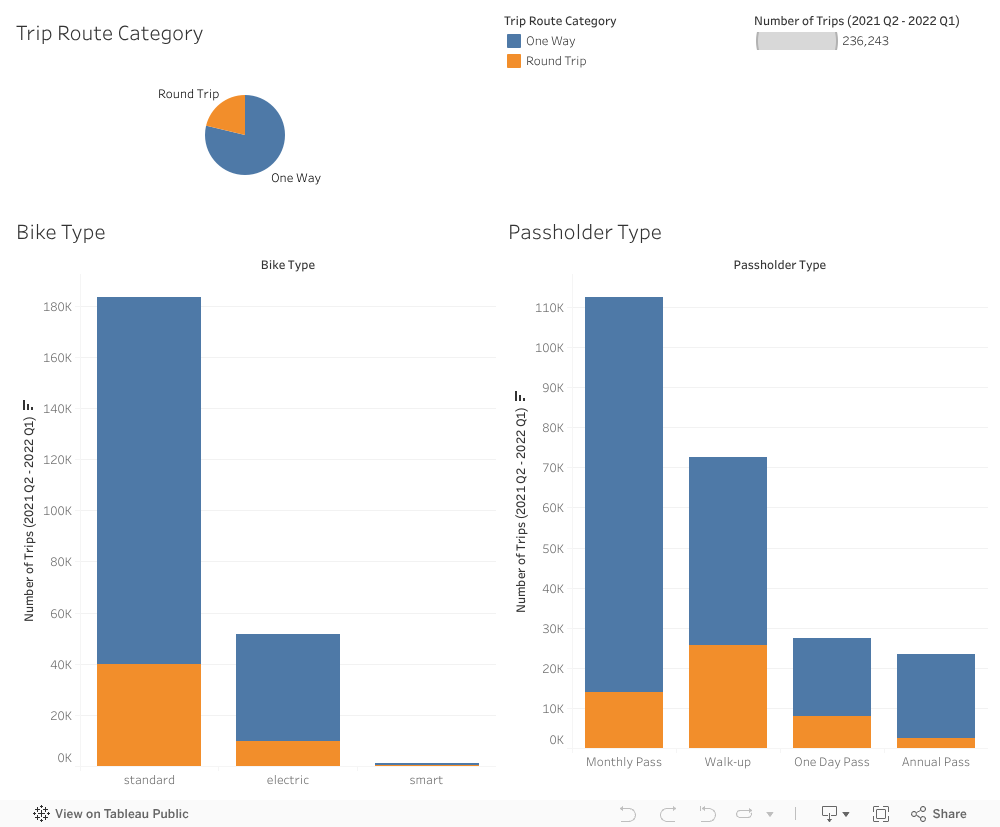
From the span of 2021-2022, standard bikes were heavily used for one way trips. Round trips were less popular for standard. Similarly, electric bikes were the most popular for one way trips compared to round trips. Overall, most riders use standard bikes where individuals pedal their way throughout the city. On the lower end, smart bikes are rarely used for both round and one way trips. Metro Smart Bikes are not required to be physically docked to a bike share station. The company has temporarily suspended the availability of smart bikes in certain stations in Los Angeles for renovation.
On our other chart,the most popular pass is the monthly and the least popular is the annual. From our pass and route data, monthly pass holders commonly rode one-way trips rather than round. Similarly, walk-up riders used the bike service for a one-way destination. However, these riders conducted more round trips than monthly pass holders. For all passes, riders conducted more one-way trips than round trips.